Economics (NCERT) Notes
Topics
All
Civil Services in India (26)
Ethics, Integrity and Aptitude
» Chapters from Book (11)
» Case Studies (8)
Solved Ethics Papers
» CSE - 2013 (18)
» CSE - 2014 (19)
» CSE - 2015 (17)
» CSE - 2016 (18)
» CSE - 2017 (19)
» CSE - 2018 (19)
» CSE - 2019 (19)
» CSE - 2020 (19)
» CSE - 2021 (19)
» CSE -2022 (17)
» CSE-2023 (17)
Essay and Answer Writing
» Quotes (34)
» Moral Stories (18)
» Anecdotes (11)
» Beautiful Poems (10)
» Chapters from Book (5)
» UPSC Essays (40)
» Model Essays (38)
» Research and Studies (4)
Economics (NCERT) Notes
» Class IX (14)
» Class X (16)
» Class XI (55)
» Class XII (53)
Economics Current (51)
International Affairs (20)
Polity and Governance (61)
Misc (77)
Select Topic »

Civil Services in India (26)
Ethics, Integrity and Aptitude (-)
» Chapters from Book (11)
» Case Studies (8)
Solved Ethics Papers (-)
» CSE - 2013 (18)
» CSE - 2014 (19)
» CSE - 2015 (17)
» CSE - 2016 (18)
» CSE - 2017 (19)
» CSE - 2018 (19)
» CSE - 2019 (19)
» CSE - 2020 (19)
» CSE - 2021 (19)
» CSE -2022 (17)
» CSE-2023 (17)
Essay and Answer Writing (-)
» Quotes (34)
» Moral Stories (18)
» Anecdotes (11)
» Beautiful Poems (10)
» Chapters from Book (5)
» UPSC Essays (40)
» Model Essays (38)
» Research and Studies (4)
Economics (NCERT) Notes (-)
» Class IX (14)
» Class X (16)
» Class XI (55)
» Class XII (53)
Economics Current (51)
International Affairs (20)
Polity and Governance (61)
Misc (77)

6.2 Price Quantity Relationship for a Monopoly Firm
Market Demand Curve

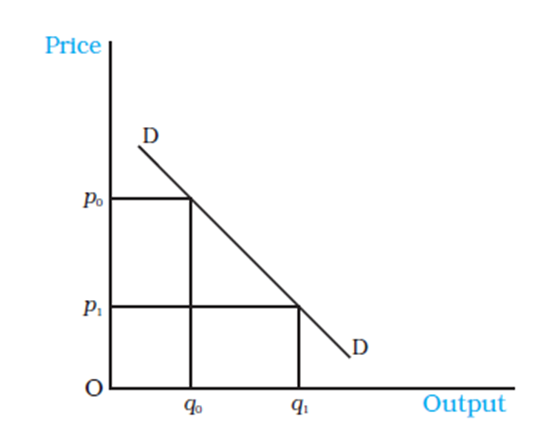
•The market demand curve in Figure shows the quantities that consumers as a whole are willing to purchase at different prices.
•If the market price is at p0, consumers are willing to purchase the quantity q0.
•If the market price is at the lower level p1, consumers are willing to buy a higher quantity q1.
•Thus the price in the market affects the quantity demanded by the consumers.
•Thus the quantity purchased by the consumers is a decreasing function of the price.
Price Quantity relationship for a monopoly firm
•For the monopoly firm, the argument expresses itself from the reverse direction.
•If the monopoly firm brings a smaller quantity of the commodity into the market for sale it will be able to sell at a higher price.
•Thus, for the monopoly firm, the price depends on the quantity of the commodity sold.
•Thus the price is a decreasing function of the quantity sold.
•Thus, for the monopoly firm, the market demand curve expresses the price that consumers are willing to pay for different quantities supplied.
•The monopoly firm faces the market demand curve, which is downward sloping.
Behaviour of a monopoly firm
•A firm is assumed to have perfect knowledge of the market demand curve.
•The monopoly firm can decide the price at which it wishes to sell its commodity, and therefore, determines the quantity to be sold.
•Since the monopoly firm is aware of the shape of the curve DD, if it wishes to sell the commodity at the price p0, it can do so by producing and selling quantity q0, since at the price p0, consumers are willing to purchase the quantity q0.
•On the other hand, if it wants to sell q1, it will only be able to do so at the price p1.
Comparison of monopoly and competitive structure
•In a perfectly competitive market structure, the firm could bring into the market as much quantity of the commodity as it wished and could sell it at the same price.
•This does not happen in case of monopoly first.
•Hence, a monopoly firm examines the amount received by the firm through the sale of the commodity by fixing suitable quantity and price.
Price and Revenue of a Monopoly firm
•Let the demand function be given by the equation
•q = 20 – 2p,
•where q is the quantity sold and p is the price in rupees.
•Hence, p = 10 – 0.5q
•Substituting different values of q from 0 to 13 gives us the prices from 10 to 3.5.
•The total revenue (TR) received by the firm from the sale of the commodity equals the product of the price and the quantity sold.
Total, Average and Marginal Revenue Curves
•In the case of the monopoly firm, the total revenue is not a straight line.
•Its shape depends on the shape of the demand curve.
•TR is represented as a function of quantity sold.
•Hence, in the example
TR = p × q = (10 – 0.5q) × q
= 10q – 0.5q2
•This equation represents an inverted vertical parabola.
Price and Revenue of a Monopoly firm
.png)
•In Table, the TR column represents the product of the p and q columns.
•It can be noticed that as the quantity increases, TR increases to Rs 50 when output becomes 10 units, and after this level of output, total revenue starts declining.
•The revenue received by the firm per unit of commodity sold is called the Average Revenue (AR).
•AR = TR/q.
Average Revenue
•The AR values turn out to be the same as the values in the p column.
•This happens because
•AR = TR/q
•Since TR = p × q, substituting this into the AR equation
•AR = (p q)/q = p
•The AR curve will therefore lie exactly on the market demand curve.
Relation between Average Revenue and Total Revenue Curves
•The average revenue at any level of output is given by the slope of the line joining the origin and the point on the total revenue curve corresponding to the output level under consideration.
| Related Articles |
| Recent Articles |
